
Single-digit flow efficiency.
The rest of the lead time
is waiting.
In electronics assembly, flow efficiency is often in the single-digit percent range. RheoNet shows where assemblies sit between stations, which orders will miss their due date and where rework is occupying test capacity. As decision support on top of ERP and MES, not as a new system.
Five situations from electronics assembly
Not because anyone is doing something wrong. Because ERP, MES and test logs each know one part and none of them knows the whole.
The devices are waiting. Where and for how long, nobody knows.
Processing time is a fraction of lead time. The rest is spread across buffers in front of the test area, intermediate storage and waiting for release. The same product takes two days one time and eight days the next.
Scrap close to zero. First pass yield is a different story.
A failed test result is not scrap, it is a second run. Every repeat run occupies a station, extends lead time and shows up in no scrap statistic. Hidden capacity that is not in the OEE.
Orders have to be dropped in days ahead.
Three to five days of lead-in are the rule. With one to two days you would be ahead of the market. That is a revenue argument, not a cost argument.
WIP in front of the test area escalates, and you notice when it is too late.
No alarm, only the monthly report. By then the buffer has already slowed down the line behind it.
ERP knows the order, MES knows the line, the link is manual.
Plan and shop-floor reality drift apart. Anyone who wants to know where an order currently stands asks someone to go and look.
What RheoNet makes visible in electronics assembly
The system reads ERP confirmations and test logs exactly as they are produced today, and calculates the flow between the stations. The MES keeps controlling.
01Idle time per station and order
From start and end of each operation, whether from a confirmation or a test log, it becomes visible where assemblies wait and for how long. Flow efficiency per product family, calculated rather than estimated.
02First pass yield per station
From serial number, station, timestamp and result comes a repeat rate per station and product family. Plus a list of where rework is currently occupying capacity. The data usually already sits in the test logs.
03Delay risk per order
From due date, progress and current idle time the system identifies orders that are likely to miss their date, before the customer does. As a notification, not a report.
04Buffers and WIP per area
Inventory between operations per area. Escalation becomes visible before the line blocks, not in the monthly report afterwards.
05Production cockpit on top of ERP and MES
One view that answers the operational question: what sits where, what is critical, what should run next. People decide, the MES keeps controlling.
06AI assistant on the real data
Questions in plain language, answers from your data: "Which orders will miss their due date if test station 3 goes down today?"
On-time delivery with names attached
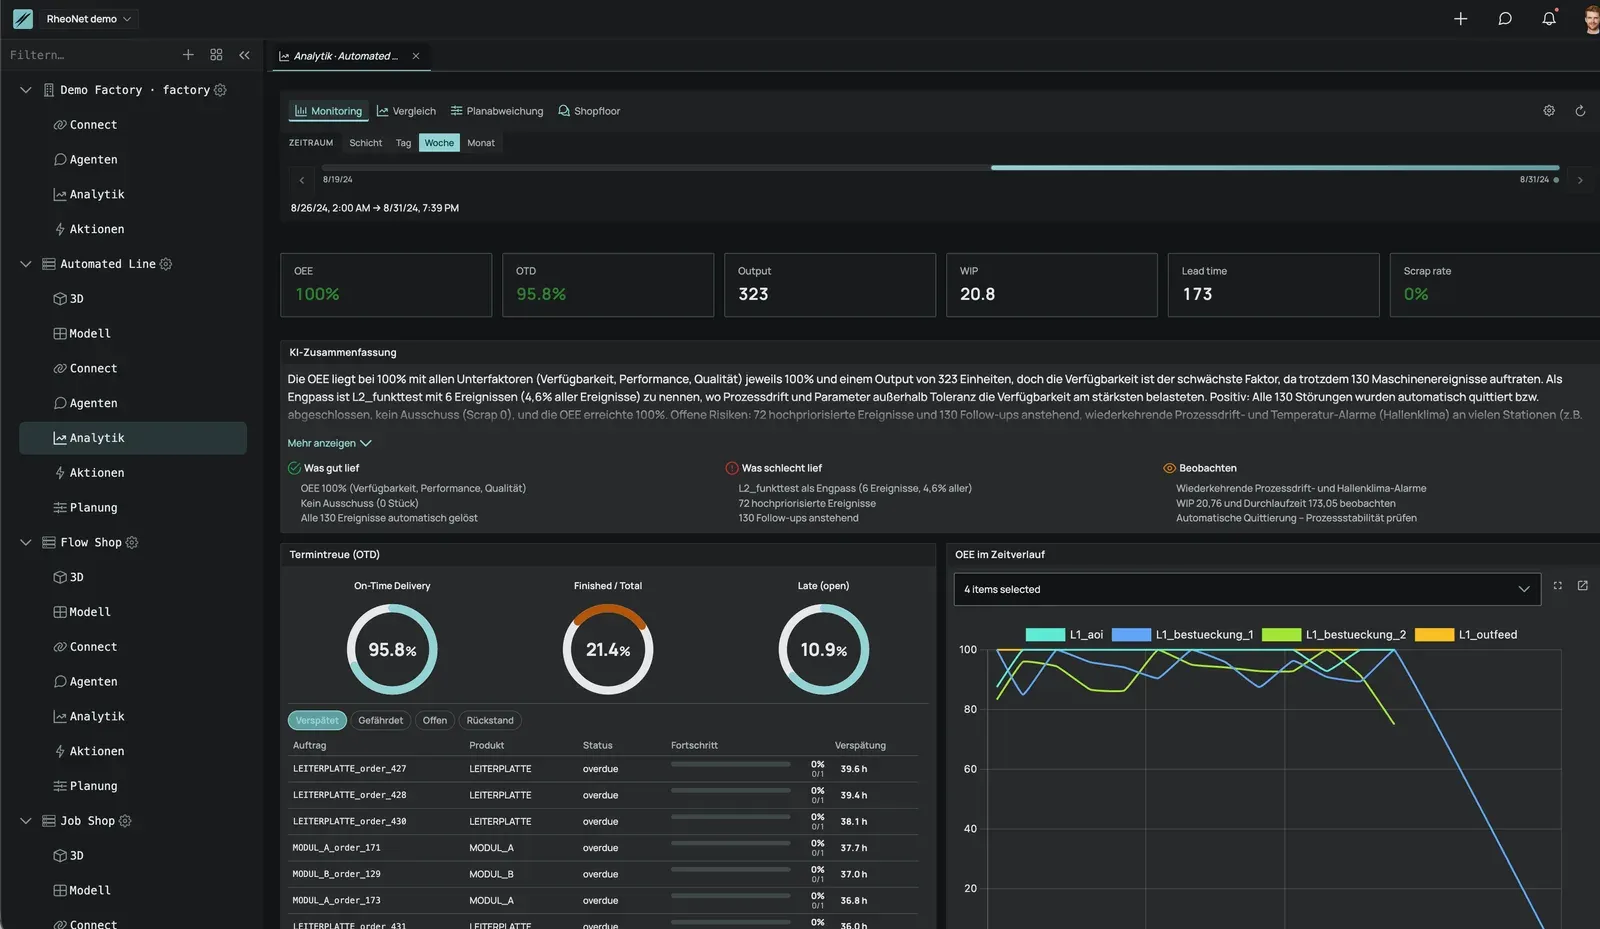
Not just the rate, but the list: which orders are late, by how many hours, and what happened during the week. The summary at the top is written by the system from the events themselves: bottleneck, cause, open risks. OEE, WIP and lead time sit next to it, calculated from the same data.
Plan versus actual, per process and station
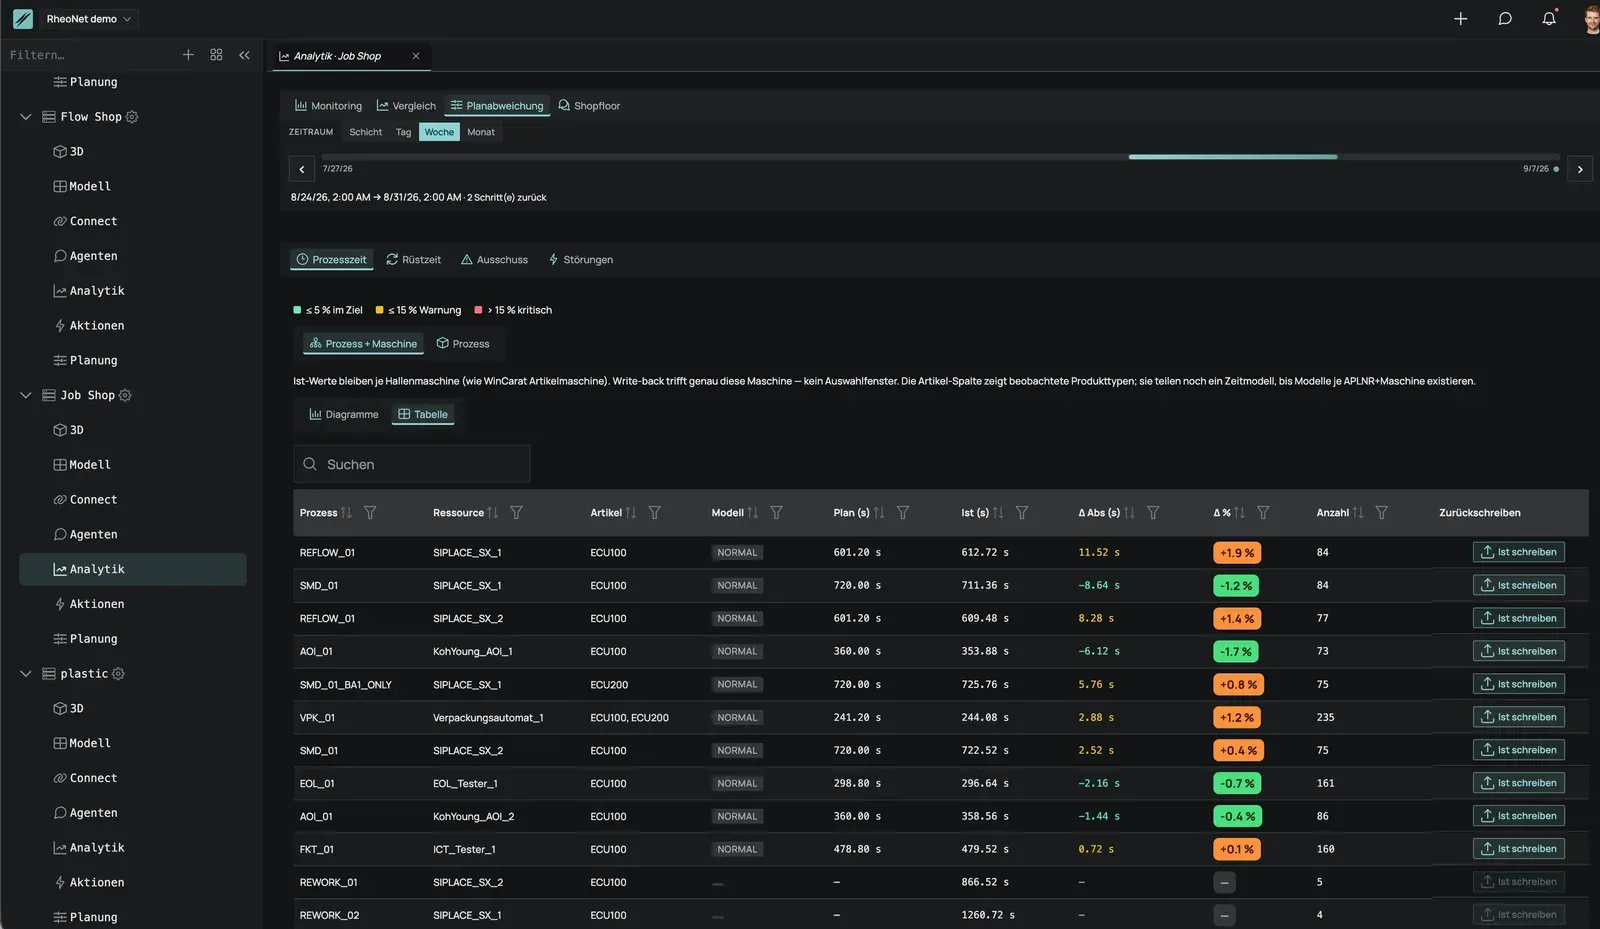
Reflow, placement, AOI, ICT: for every process the stored time sits next to the measured one, with the deviation in seconds and percent and the number of observations behind it. Where master data has been off for years, the system writes the actual value back on click. Traceable, not silently in the background.
What a start needs. And what it does not.
RheoNet reads the data the way it is produced today. Which extract is enough for a first look is clarified on the call. No access to your systems.
Enough to start
- checkERP order and confirmation data as an export (an SAP export is enough)
- checkTest data per serial number and station (log files or test database)
- checkOptional: MES status per operation
Not required
- closeNo interference with the MES, no new interface
- closeNo new control system
- closeNo additional bookings on the shop floor
- closeNo IT project on your side
Does RheoNet fit your electronics assembly?
Three steps, each without obligation. After each one, you decide whether to continue.
Self-check
Eleven questions about systems and data collection, three minutes. Then a detailed assessment: what the system would show with your data in week 1 and what is still missing.
Call
20 minutes. We clarify which data exists today and whether a data check makes sense.
Free data check
After the call: an agreed extract under NDA, after one week your data as a live view.